
Short Summary:
Factors affecting demand:
•
a) Substitute – product that you view similar or identical to one you considering to purchase
b) Complement – good that you like to consume at the same time as the product you are considering to buy
• Income determines how much consumer will purchase • Government rules and regulations affecting purchase decisions
Quantity demanded – the amount of a good that consumers are willing to buy at given price, holding other factors that can influence the decision constant
Demand curve – relation between prices and quantity demanded; quantity demanded at each possible price, holding constant other factors (Q - quantity demanded is usually expressed as some physical measure per time period)
Law of Demand – consumers demand more of a good the lower its price holding constant other factors - demand curve slope downward
Change in price – movement along the demand curve Change in any other factor – shift of the curve
Demand function: Q = D(p,q,r,s,Y) - how the quantity of a demanded good is dependable on the price of other goods and on your disposable income. Slope of the demand function: rise/run dP/dQ
(negative slope is consistent with the Law of Demand)
Total demand: sum of all individual demand curves (only possible when everyone face the same price)
Factors affecting the supply: •
Quantity supplied – amount of a good that firms want to sell at a given price, holding constant other factors
Supply curve – a quantity supplied at each possible price, holding constant the other factors that influence firm’s supply decisions Change in price – movement along the supply curve - the higher the price of a product, the more the firm wants to sell, the more it supplies
Change in any other factor = shift of the supply curve
Supply function: Q = S(p,pb) F how the quantity of supplied good is dependable on the price of this good, on the price of other goods Total supply: total quantity produced by all suppliers at each possible price
Effects of government import policies on supply curves:
Quota – limit that a government sets on the quantity of foreign- produced goods that may be imported Without any ban on the supply, the supply of the product is equal to the domestic and foreign supply.(flatter supply curve) When there is a ban, the overall supply is just the domestic supply. (steeper curve)
The supply of the foreign ;irms is vertical at the quota value (no matter what the price is, they can not supply more than the established quota value)
Market equilibrium:
Excess demand – amount by which the quantity demanded exceeds the quantity supplied at specified price
Excess supply – amount by which the quantity supplied is greater than the quantity demanded at a specified price
Equilibrium changes only if shock occurs that shifts the demand curve or the supply curve – those shifts occurs only if one of the variables that were hold constant change
Shocking the equilibrium
Equilibrium of supply and demand can only change if the shock (change in the price of substitute or the input) occurs, which shifts the demand curve or the supply curve.
Effects of Government interventions Policies which shifts the supply curve:
Licensing laws: limiting the number of firms that can sell goods in a market(e.g. Limit on the number of taxicabs)
Quotas: limiting the amount of a good that can be sold(common in limiting imports)
Policies that cause the demand to differ from supply:
Some governmental actions can cause excess supply/demand if e.g there is direct control of a prices, which are not established at its equilibrium value
Price ceiling = price controlling stating that the price can not be higher than given value of price ceiling;enforced price ceiling can cause a shortage, which is the persistent excess demand (excessive demand (Qd-Qs))
If the price ceiling is above the equilibrium value it does not affect the price; non binding price ceiling
Price Floor = price at which goods is sold can not fall below established value (e.g minimum wage) (LsFLd F unemployment (permanent excessive supply))
When to use the supply and demand model?
Transaction costs = the expenses of finding a trading partner and making a trade for a good or service beyond the price paid for the good or service
- Consumer’s tastes determine what to buy
- Information about the uses of a good affects consumers’ decision
- Prices of other goods
a) Substitute – product that you view similar or identical to one you considering to purchase
b) Complement – good that you like to consume at the same time as the product you are considering to buy
• Income determines how much consumer will purchase • Government rules and regulations affecting purchase decisions
Quantity demanded – the amount of a good that consumers are willing to buy at given price, holding other factors that can influence the decision constant
Demand curve – relation between prices and quantity demanded; quantity demanded at each possible price, holding constant other factors (Q - quantity demanded is usually expressed as some physical measure per time period)
Law of Demand – consumers demand more of a good the lower its price holding constant other factors - demand curve slope downward
Change in price – movement along the demand curve Change in any other factor – shift of the curve
Demand function: Q = D(p,q,r,s,Y) - how the quantity of a demanded good is dependable on the price of other goods and on your disposable income. Slope of the demand function: rise/run dP/dQ
(negative slope is consistent with the Law of Demand)
Total demand: sum of all individual demand curves (only possible when everyone face the same price)
Factors affecting the supply: •
- Costs of production - the less is the cost of producing, the more a firm wants to supply
•
- Government rules and regulations - taxes, costs of covering pollutions, health insurance for workers - altering costs of production
Quantity supplied – amount of a good that firms want to sell at a given price, holding constant other factors
Supply curve – a quantity supplied at each possible price, holding constant the other factors that influence firm’s supply decisions Change in price – movement along the supply curve - the higher the price of a product, the more the firm wants to sell, the more it supplies
Change in any other factor = shift of the supply curve
Supply function: Q = S(p,pb) F how the quantity of supplied good is dependable on the price of this good, on the price of other goods Total supply: total quantity produced by all suppliers at each possible price
Effects of government import policies on supply curves:
Quota – limit that a government sets on the quantity of foreign- produced goods that may be imported Without any ban on the supply, the supply of the product is equal to the domestic and foreign supply.(flatter supply curve) When there is a ban, the overall supply is just the domestic supply. (steeper curve)
The supply of the foreign ;irms is vertical at the quota value (no matter what the price is, they can not supply more than the established quota value)
Market equilibrium:
- Equilibrium – situation in which no one wants to change his or her behavior – point where the supply and demand curve meets
- Equilibrium price – price at which consumers can buy as much as they want and sellers can sell as much as they want F called also the market clearing price as it removes from the market all unsatisfied buyers and sellers
- Equilibrium quantity – quantity that is bought and sold at the equilibrium price Determining the equilibrium point: Q(d) f Q(s) Disequilibrium: quantity demanded is not equal to the quantity supplied
Excess demand – amount by which the quantity demanded exceeds the quantity supplied at specified price
Excess supply – amount by which the quantity supplied is greater than the quantity demanded at a specified price
Equilibrium changes only if shock occurs that shifts the demand curve or the supply curve – those shifts occurs only if one of the variables that were hold constant change
Shocking the equilibrium
Equilibrium of supply and demand can only change if the shock (change in the price of substitute or the input) occurs, which shifts the demand curve or the supply curve.
- Shift of the demand curve causes a movement along the supply curve, until the new equilibrium is achieved.
- Shift of the supply curve causes a movement along the demand curve, until the new equilibrium is reached.
Effects of Government interventions Policies which shifts the supply curve:
Licensing laws: limiting the number of firms that can sell goods in a market(e.g. Limit on the number of taxicabs)
Quotas: limiting the amount of a good that can be sold(common in limiting imports)
Policies that cause the demand to differ from supply:
Some governmental actions can cause excess supply/demand if e.g there is direct control of a prices, which are not established at its equilibrium value
Price ceiling = price controlling stating that the price can not be higher than given value of price ceiling;enforced price ceiling can cause a shortage, which is the persistent excess demand (excessive demand (Qd-Qs))
If the price ceiling is above the equilibrium value it does not affect the price; non binding price ceiling
Price Floor = price at which goods is sold can not fall below established value (e.g minimum wage) (LsFLd F unemployment (permanent excessive supply))
When to use the supply and demand model?
- Everyone is a price taker (no one can affect the market price)
- Firms sell identical products
- Everyone has full information about the price and quality of goods
- Costs of trading are low (all features of perfectly competitive markets)
Transaction costs = the expenses of finding a trading partner and making a trade for a good or service beyond the price paid for the good or service
Or read it below
54 Multiple Choice Questions concerning chapter 2
(Same questions used in Eleum Quizzes)
Choose the one alternative that best completes the statement or answers the question.
Good Luck !
1) According to the Law of Demand, the demand curve for a good will
A) shift leftward when the price of the good increases.
B) shift rightward when the price of the good increases.
C) slope downward.
D) slope upward.
Topic: Demand
2) As the price of a good increases, the change in the quantity demanded can be shown by
A) shifting the demand curve leftward.
B) shifting the demand curve rightward.
C) moving down along the same demand curve.
D) moving up along the same demand curve.
Topic: Demand
3) If the price of automobiles were to increase substantially, the demand curve for gasoline would most likely
A) shift leftward.
B) shift rightward.
C) become flatter.
D) become steeper.
Topic: Demand
4) If the price of automobiles were to decrease substantially, the demand curve for public transportation would most likely
A) shift rightward.
B) shift leftward.
C) remain unchanged.
D) remain unchanged while quantity demanded would change.
Topic: Demand
5) An increase in the demand curve for orange juice would be illustrated as a
A) leftward shift of the demand curve.
B) rightward shift of the demand curve.
C) movement up along the demand curve.
D) movement down along the demand curve.
Topic: Demand
6) The term “inverse demand curve” refers to
A) a demand curve that slopes upward.
B) expressing the demand curve in terms of price as a function of quantity.
C) the demand for “inverses.”
D) the difference between quantity demanded and supplied at each price.
Topic: Demand
7) If the demand for oranges is written as Q = 100 - 5p, then the inverse demand function is
A) Q = 5p - 100.
B) Q = 20 - .2p.
C) p = 20 - 5Q.
D) p = 20 - .2Q.
Topic: Demand
8) If government regulations prohibit the production of a particular good, the demand curve for that good will most likely
A) shift leftward.
B) shift rightward.
C) remain unchanged.
D) disappear.
Topic: Demand
9) Suppose the demand curve for a good shifts rightward, causing the equilibrium price to increase. This increase in the price of the good results in
A) a rightward shift of the supply curve.
B) an increase in quantity supplied.
C) a leftward shift of the supply curve.
D) a leftward movement along the supply curve.
Topic: Supply
10) Suppose there are 100 identical firms in the rag industry, and each firm is willing to supply 10 rags at any price. The market supply curve will be a(n)
A) vertical line where Q = 10.
B) vertical line where Q = 100.
C) vertical line where Q = 1000.
D) horizontal line where Q = 1000.
Topic: Supply
11) The expression “increase in quantity supplied” is illustrated graphically as a
A) leftward shift in the supply curve.
B) rightward shift in the supply curve.
C) movement up along the supply curve.
D) movement down along the supply curve.
Topic: Supply
12) If the supply curve of a product changes so that sellers are now willing to sell 2 additional units at any given price, the supply curve will
A) shift leftward by 2 units.
B) shift rightward by 2 units.
C) shift vertically up by 2 units.
D) shift vertically down by 2 units.
Topic: Supply
13) The market supply curve is found by
A) horizontally summing all individual supply curves.
B) vertically summing all individual supply curves.
C) Either A or B above since they both give the same answer.
D) None of the above.
Topic: Supply
14) Technological innovations in the production of computers has led to
A) a decrease in the quantity demanded for computers.
B) a rightward shift of the supply curve for computers.
C) a decrease in the quantity supplied of computers.
D) None of the above.
Topic: Supply
15) Equilibrium is defined as a situation in which
A) neither buyers nor sellers want to change their behavior.
B) no government regulations exist.
C) demand curves are perfectly horizontal.
D) suppliers will supply any amount that buyers wish to buy.
Topic: Market Equilibrium
16) A competitive equilibrium is described by
A) a price only.
B) a quantity only.
C) the excess supply minus the excess demand.
D) a price and a quantity.
Topic: Market Equilibrium
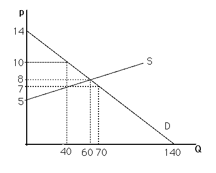 Figure 2.1
17) Figure 2.1 shows a graph of the market for pizzas in a large town. No pizzas will be supplied unless the price is above
A) $0.
B) $5.
C) $12.
D) $14.
Topic: Supply
18) Figure 2.1 shows a graph of the market for pizzas in a large town. No pizzas will be demanded unless price is less than
A) $0.
B) $5.
C) $12.
D) $14.
Topic: Demand
19) Figure 2.1 shows a graph of the market for pizzas in a large town. At a price of $14, there will be
A) no pizzas supplied.
B) equilibrium.
C) excess supply.
D) excess demand.
Topic: Market Equilibrium
20) Figure 2.1 shows a graph of the market for pizzas in a large town. At a price of $5, there will be
A) excess demand.
B) excess supply.
C) equilibrium.
D) zero demand.
Topic: Market Equilibrium
21) Figure 2.1 shows a graph of the market for pizzas in a large town. What are the equilibrium price and quantity?
A) p = 8, Q = 60
B) p = 60, Q = 8
C) p = 14, Q = 140
D) p = 5, Q = 60
Topic: Market Equilibrium
22) Figure 2.1 shows a graph of a market for pizzas in a large town. At a price of $7, what is the amount of excess demand?
A) 0; there is excess supply at $7.
B) 20 units
C) 30 units
D) 10 units
Topic: Market Equilibrium
23) Figure 2.1 shows a graph of a market for pizzas in a large town. At a price of $10, the market
A) is not in equilibrium.
B) has excess supply.
C) does not have excess demand.
D) All of the above.
Topic: Market Equilibrium
24) Figure 2.1 shows a graph of the market for pizzas in a large town. Suppose that concern over dietary habits has led the government to impose a restriction that limits suppliers to produce no more than 40 pizzas. What will the price of pizza be as a result of this quota?
A) $2
B) $7
C) $8
D) $10
Topic: Effects of Government Intervention
25) Figure 2.1 shows a graph of the market for pizzas in a large town. Suppose that concern over dietary habits has led the government to impose a restriction that limits suppliers to produce only 40 pizzas. As a result, for prices greater than $7, the
A) supply curve is unchanged.
B) supply curve is vertical.
C) demand curve becomes vertical.
D) demand curve becomes horizontal.
Topic: Effects of Government Intervention
26) Figure 2.1 shows a graph of the market for pizzas in a large town. As a result of concern over the affordability of pizza, the government restricts sellers from charging a price over $7. As a result, the quantity of pizzas consumed will
A) increase.
B) decrease.
C) remain unchanged.
D) be indeterminable.
Topic: Effects of Government Intervention
27) If pizza and tacos are substitutes, a decrease in the price of tacos would lead to a
A) decrease in the demand curve for pizza.
B) decrease in the quantity demanded of pizza.
C) decrease in the price of pizza.
D) All of the above.
Topic: Shocking the Equilibrium
A) $0.
B) $5.
C) $12.
D) $14.
Topic: Supply
18) Figure 2.1 shows a graph of the market for pizzas in a large town. No pizzas will be demanded unless price is less than
A) $0.
B) $5.
C) $12.
D) $14.
Topic: Demand
19) Figure 2.1 shows a graph of the market for pizzas in a large town. At a price of $14, there will be
A) no pizzas supplied.
B) equilibrium.
C) excess supply.
D) excess demand.
Topic: Market Equilibrium
20) Figure 2.1 shows a graph of the market for pizzas in a large town. At a price of $5, there will be
A) excess demand.
B) excess supply.
C) equilibrium.
D) zero demand.
Topic: Market Equilibrium
21) Figure 2.1 shows a graph of the market for pizzas in a large town. What are the equilibrium price and quantity?
A) p = 8, Q = 60
B) p = 60, Q = 8
C) p = 14, Q = 140
D) p = 5, Q = 60
Topic: Market Equilibrium
22) Figure 2.1 shows a graph of a market for pizzas in a large town. At a price of $7, what is the amount of excess demand?
A) 0; there is excess supply at $7.
B) 20 units
C) 30 units
D) 10 units
Topic: Market Equilibrium
23) Figure 2.1 shows a graph of a market for pizzas in a large town. At a price of $10, the market
A) is not in equilibrium.
B) has excess supply.
C) does not have excess demand.
D) All of the above.
Topic: Market Equilibrium
24) Figure 2.1 shows a graph of the market for pizzas in a large town. Suppose that concern over dietary habits has led the government to impose a restriction that limits suppliers to produce no more than 40 pizzas. What will the price of pizza be as a result of this quota?
A) $2
B) $7
C) $8
D) $10
Topic: Effects of Government Intervention
25) Figure 2.1 shows a graph of the market for pizzas in a large town. Suppose that concern over dietary habits has led the government to impose a restriction that limits suppliers to produce only 40 pizzas. As a result, for prices greater than $7, the
A) supply curve is unchanged.
B) supply curve is vertical.
C) demand curve becomes vertical.
D) demand curve becomes horizontal.
Topic: Effects of Government Intervention
26) Figure 2.1 shows a graph of the market for pizzas in a large town. As a result of concern over the affordability of pizza, the government restricts sellers from charging a price over $7. As a result, the quantity of pizzas consumed will
A) increase.
B) decrease.
C) remain unchanged.
D) be indeterminable.
Topic: Effects of Government Intervention
27) If pizza and tacos are substitutes, a decrease in the price of tacos would lead to a
A) decrease in the demand curve for pizza.
B) decrease in the quantity demanded of pizza.
C) decrease in the price of pizza.
D) All of the above.
Topic: Shocking the Equilibrium
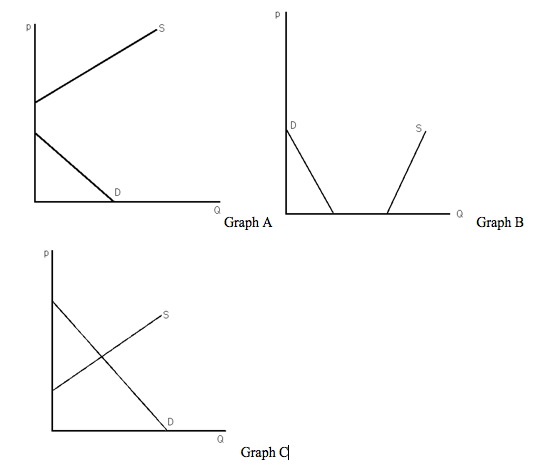 Figure 2.2
28) Figure 2.2 shows three different supply-and-demand graphs. Which graph best represents the market for vacations on Mars?
A) graph A
B) graph B
C) graph C
D) None of the above.
Topic: Market Equilibrium
29) Figure 2.2 shows three different supply-and-demand graphs. Which graph best represents the market for workers at your nearest fast-food restaurant?
A) graph A
B) graph B
C) graph C
D) None of the above.
Topic: Market Equilibrium
30) Figure 2.2 shows three different supply-and-demand graphs. Which graph best represents the market for the air we are currently breathing?
A) graph A
B) graph B
C) graph C
D) None of the above.
Topic: Market Equilibrium
31) After tickets for a major sporting event are purchased at the official box office price, a market often develops whereby these tickets sell at prices well above the official box office price. Which of the following scenarios would NOT be able to explain this result?
A) The official price was below equilibrium from the moment the tickets were available.
B) Increased publicity causes the demand curve for the event to shift rightward.
C) The event was not a sellout.
D) Not everyone who wanted a ticket was able to buy one at the box office.
Topic: Market Equilibrium
32) Restricting imports tends to
A) shift the demand curve for the product to the left.
B) shift the demand curve for the product to the right.
C) change the shape of the supply curve.
D) increase the quantity supplied of a product.
Topic: Effects of Government Intervention
33) A drought in the Midwest will raise the price of wheat because of a
A) leftward shift in the supply curve.
B) rightward shift in the supply curve.
C) leftward shift in the demand curve.
D) rightward shift in the demand curve.
Topic: Shocking the Equilibrium
34) Government prohibition of advertising liquor on television would most likely result in
A) a rightward shift in the demand curve for liquor.
B) a leftward shift in the demand curve for liquor.
C) a rightward shift in the demand curve for television advertising time.
D) no change in the market for either liquor or television advertising.
Topic: Shocking the Equilibrium
35) From the 1970s through the 1990s, the relative price of a college education has increased greatly. During the same time period, college enrollment has also increased. This evidence suggests that during this time period
A) the demand curve for a college education has shifted leftward.
B) the demand curve for a college education has shifted rightward.
C) the supply curve for a college education has shifted leftward.
D) the supply curve for a college education has shifted rightward.
Topic: Shocking the Equilibrium
A) graph A
B) graph B
C) graph C
D) None of the above.
Topic: Market Equilibrium
29) Figure 2.2 shows three different supply-and-demand graphs. Which graph best represents the market for workers at your nearest fast-food restaurant?
A) graph A
B) graph B
C) graph C
D) None of the above.
Topic: Market Equilibrium
30) Figure 2.2 shows three different supply-and-demand graphs. Which graph best represents the market for the air we are currently breathing?
A) graph A
B) graph B
C) graph C
D) None of the above.
Topic: Market Equilibrium
31) After tickets for a major sporting event are purchased at the official box office price, a market often develops whereby these tickets sell at prices well above the official box office price. Which of the following scenarios would NOT be able to explain this result?
A) The official price was below equilibrium from the moment the tickets were available.
B) Increased publicity causes the demand curve for the event to shift rightward.
C) The event was not a sellout.
D) Not everyone who wanted a ticket was able to buy one at the box office.
Topic: Market Equilibrium
32) Restricting imports tends to
A) shift the demand curve for the product to the left.
B) shift the demand curve for the product to the right.
C) change the shape of the supply curve.
D) increase the quantity supplied of a product.
Topic: Effects of Government Intervention
33) A drought in the Midwest will raise the price of wheat because of a
A) leftward shift in the supply curve.
B) rightward shift in the supply curve.
C) leftward shift in the demand curve.
D) rightward shift in the demand curve.
Topic: Shocking the Equilibrium
34) Government prohibition of advertising liquor on television would most likely result in
A) a rightward shift in the demand curve for liquor.
B) a leftward shift in the demand curve for liquor.
C) a rightward shift in the demand curve for television advertising time.
D) no change in the market for either liquor or television advertising.
Topic: Shocking the Equilibrium
35) From the 1970s through the 1990s, the relative price of a college education has increased greatly. During the same time period, college enrollment has also increased. This evidence suggests that during this time period
A) the demand curve for a college education has shifted leftward.
B) the demand curve for a college education has shifted rightward.
C) the supply curve for a college education has shifted leftward.
D) the supply curve for a college education has shifted rightward.
Topic: Shocking the Equilibrium
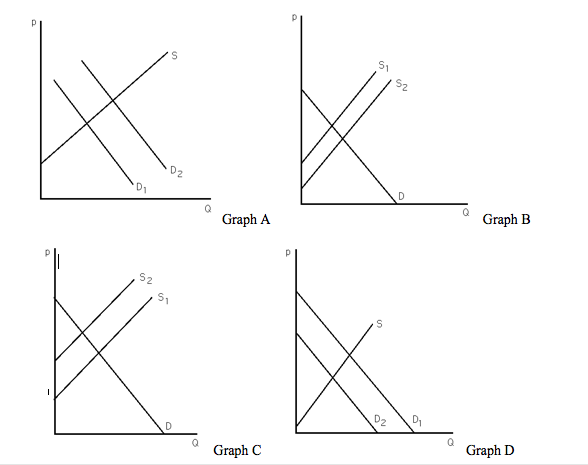 Figure 2.3
36) Figure 2.3 shows four different markets with changes in either the supply curve or the demand curve. Which graph best illustrates the market for coffee after severe weather destroys a large portion of the coffee crop?
A) graph A
B) graph B
C) graph C
D) graph D
Topic: Shocking the Equilibrium
37) Figure 2.3 shows four different markets with changes in either the supply curve or the demand curve. Which graph best illustrates the market for tea after severe weather destroys a large portion of the coffee crop?
A) graph A
B) graph B
C) graph C
D) graph D
Topic: Shocking the Equilibrium
38) Figure 2.3 shows four different markets with changes in either the supply curve or the demand curve. Which graph best illustrates the market for non-dairy coffee creamer after severe weather destroys a large portion of the coffee crop?
A) graph A
B) graph B
C) graph C
D) graph D
Topic: Shocking the Equilibrium
39) Figure 2.3 shows four different markets with changes in either the supply curve or the demand curve. Which graph best illustrates the market for computers after technological advances in making computers occur?
A) graph A
B) graph B
C) graph C
D) graph D
Topic: Shocking the Equilibrium
40) Figure 2.3 shows four different markets with changes in either the supply curve or the demand curve. Which graph best illustrates the market for computer manuals after technological advances in making computers occur?
A) graph A
B) graph B
C) graph C
D) graph D
Topic: Shocking the Equilibrium
41) Figure 2.3 shows four different markets with changes in either the supply curve or the demand curve. Which graph best illustrates the market for typewriters after technological advances in computerized word-processing software occur?
A) graph A
B) graph B
C) graph C
D) graph D
Topic: Shocking the Equilibrium
42) Suppose a market were currently at equilibrium. A rightward shift of the demand curve would cause
A) an increase in price but a decrease in quantity.
B) a decrease in price but an increase in quantity.
C) an increase in both price and quantity.
D) a decrease in both price and quantity.
Topic: Shocking the Equilibrium
43) Suppose a market were currently at equilibrium. A rightward shift of the supply curve would cause a(n)
A) increase in price but a decrease in quantity.
B) decrease in price but an increase in quantity.
C) increase in both price and quantity.
D) decrease in both price and quantity.
Topic: Shocking the Equilibrium
44) When import restrictions are placed on a good, and as a result the price of the good increases, the demand curve for that good will
A) shift rightward.
B) shift leftward.
C) become steeper.
D) be unaffected.
Topic: Shocking the Equilibrium
45) When two goods are substitutes, a shock that raises the price of one good causes the price of the other good to
A) remain unchanged.
B) decrease.
C) increase.
D) change in an unpredictable manner.
Topic: Shocking the Equilibrium
46) Municipalities that have adopted the policy of “rent control” typically set the rentals on certain apartments well below equilibrium. As a result,
A) landlords have a difficult time finding tenants.
B) prospective tenants have a difficult time finding available apartments.
C) there is a surplus of apartments.
D) All of the above.
Topic: Effects of Government Intervention
47) When “rent controls” result in a shortage of housing, landlords
A) use criteria other than price to allocate housing.
B) lower the price to allocate the housing.
C) attempt to attract renters.
D) None of the above.
Topic: Effects of Government Interventions
48) A restriction on the number of people allowed to be medical doctors in the United States would most likely
A) increase doctors’ fees.
B) decrease the demand for doctors.
C) decrease the demand for nurses.
D) decrease the number of people who get sick.
Topic: Effects of Government Intervention
A) graph A
B) graph B
C) graph C
D) graph D
Topic: Shocking the Equilibrium
37) Figure 2.3 shows four different markets with changes in either the supply curve or the demand curve. Which graph best illustrates the market for tea after severe weather destroys a large portion of the coffee crop?
A) graph A
B) graph B
C) graph C
D) graph D
Topic: Shocking the Equilibrium
38) Figure 2.3 shows four different markets with changes in either the supply curve or the demand curve. Which graph best illustrates the market for non-dairy coffee creamer after severe weather destroys a large portion of the coffee crop?
A) graph A
B) graph B
C) graph C
D) graph D
Topic: Shocking the Equilibrium
39) Figure 2.3 shows four different markets with changes in either the supply curve or the demand curve. Which graph best illustrates the market for computers after technological advances in making computers occur?
A) graph A
B) graph B
C) graph C
D) graph D
Topic: Shocking the Equilibrium
40) Figure 2.3 shows four different markets with changes in either the supply curve or the demand curve. Which graph best illustrates the market for computer manuals after technological advances in making computers occur?
A) graph A
B) graph B
C) graph C
D) graph D
Topic: Shocking the Equilibrium
41) Figure 2.3 shows four different markets with changes in either the supply curve or the demand curve. Which graph best illustrates the market for typewriters after technological advances in computerized word-processing software occur?
A) graph A
B) graph B
C) graph C
D) graph D
Topic: Shocking the Equilibrium
42) Suppose a market were currently at equilibrium. A rightward shift of the demand curve would cause
A) an increase in price but a decrease in quantity.
B) a decrease in price but an increase in quantity.
C) an increase in both price and quantity.
D) a decrease in both price and quantity.
Topic: Shocking the Equilibrium
43) Suppose a market were currently at equilibrium. A rightward shift of the supply curve would cause a(n)
A) increase in price but a decrease in quantity.
B) decrease in price but an increase in quantity.
C) increase in both price and quantity.
D) decrease in both price and quantity.
Topic: Shocking the Equilibrium
44) When import restrictions are placed on a good, and as a result the price of the good increases, the demand curve for that good will
A) shift rightward.
B) shift leftward.
C) become steeper.
D) be unaffected.
Topic: Shocking the Equilibrium
45) When two goods are substitutes, a shock that raises the price of one good causes the price of the other good to
A) remain unchanged.
B) decrease.
C) increase.
D) change in an unpredictable manner.
Topic: Shocking the Equilibrium
46) Municipalities that have adopted the policy of “rent control” typically set the rentals on certain apartments well below equilibrium. As a result,
A) landlords have a difficult time finding tenants.
B) prospective tenants have a difficult time finding available apartments.
C) there is a surplus of apartments.
D) All of the above.
Topic: Effects of Government Intervention
47) When “rent controls” result in a shortage of housing, landlords
A) use criteria other than price to allocate housing.
B) lower the price to allocate the housing.
C) attempt to attract renters.
D) None of the above.
Topic: Effects of Government Interventions
48) A restriction on the number of people allowed to be medical doctors in the United States would most likely
A) increase doctors’ fees.
B) decrease the demand for doctors.
C) decrease the demand for nurses.
D) decrease the number of people who get sick.
Topic: Effects of Government Intervention
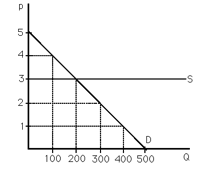 Figure 2.4
49) Figure 2.4 shows the market for crude oil. If a consumer group convinces the government to set a maximum price of $2 per barrel, then
A) 300 barrels of crude oil will be sold at $2.
B) zero barrels of crude oil will be sold.
C) zero barrels of crude oil will be demanded.
D) None of the above.
Topic: Effects of Government Intervention
50) Figure 2.4 shows the market for crude oil. If the oil exploration firms convince the government to set a minimum price of $4 per barrel, then
A) 100 barrels of crude oil will be sold at $4.
B) zero barrels of crude oil will be sold.
C) zero barrels of crude oil will be demanded.
D) None of the above.
Topic: Effects of Government Intervention
51) Figure 2.4 shows the market for crude oil. If the government restricts output to no more than 300 barrels, then
A) 300 barrels of crude oil will be sold at $3.
B) 200 barrels of crude oil will be sold at $3.
C) zero barrels of crude oil will be sold.
D) None of the above.
Topic: Market Equilibrium
52) If a government-imposed price ceiling causes the observed price in a market to be below the equilibrium price,
A) there will be excess demand.
B) there will be excess supply.
C) the curves will shift to make a new equilibrium at the regulated price.
D) None of the above.
Topic: Effects of Government Intervention
53) In the labor market, if the government imposes a minimum wage that is below the equilibrium wage, then
A) workers who wish to work at the minimum wage will have a difficult time finding jobs.
B) firms will hire fewer workers than without the minimum wage law.
C) some workers may lose their jobs as a result.
D) nothing will happen to the wage rate or employment.
Topic: Effects of Government Intervention
54) It is appropriate to use the supply and demand model if, in a market,
A) everyone is a price taker with full information about the price and quality of the good.
B) firms sell identical products.
C) costs of trading are low.
D) All of the above.
Topic: When to Use the Supply and Demand Model
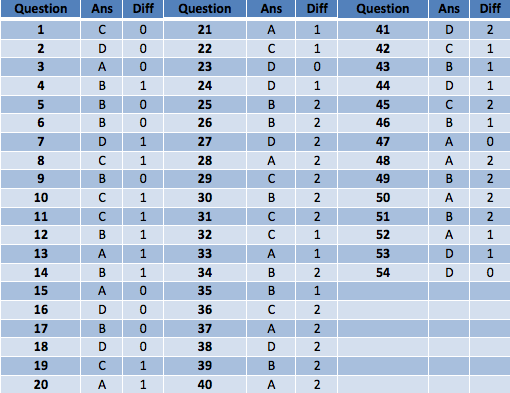
Answers and Difficulty of each questions
13 Solved Problems Regarding chapter 2
1) Suppose an individual inverse demand curve is given as P = 2 - 1/2 qi, where qi is the quantity demanded by individual i. There are 50 individual consumers with this identical, individual inverse demand curve. Solve for the market demand curve
2) Suppose the market demand curve for pizza can be expressed as QD = 100 - 2P + 3Pb, where QD is the quantity of pizza demanded, P is the price of a pizza, and Pb is the price of a burrito. What is the slope of this demand curve, and what information does the slope provide?
3) Suppose the demand for a particular product can be expressed as Q = 100/p. Calculate the total amount spent on this good when p = 10, 20, and 50. Can you make a generalization about the mathematical form of this demand curve and consumer behavior in this market?
4) Suppose the following information is known about a market:
5) Suppose the market for potatoes can be expressed as follows:
2) Suppose the market demand curve for pizza can be expressed as QD = 100 - 2P + 3Pb, where QD is the quantity of pizza demanded, P is the price of a pizza, and Pb is the price of a burrito. What is the slope of this demand curve, and what information does the slope provide?
3) Suppose the demand for a particular product can be expressed as Q = 100/p. Calculate the total amount spent on this good when p = 10, 20, and 50. Can you make a generalization about the mathematical form of this demand curve and consumer behavior in this market?
4) Suppose the following information is known about a market:
- Sellers will not sell at all below a price of $2.
- At a price of $10, any given seller will sell 10 units.
- There are 100 identical sellers in the market.
5) Suppose the market for potatoes can be expressed as follows:
- Supply: QS = -20 + 10p
- Demand: QD = 400 - 20p
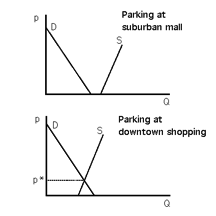 Figure 2.5
6) Use supply-and-demand graphs to explain why parking is free at the suburban shopping mall but one typically must pay to park when shopping downtown.
Figure 2.6
7) What happens to the equilibrium price and quantity of coffee when there is a leftward shift of the supply curve for tea? Explain.
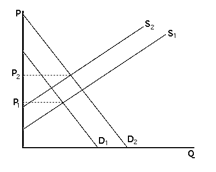 Figure 2.7
8) Suppose there is a linear downward-sloping demand curve and a linear upward-sloping supply curve for a good. The price of a substitute good increases and the price of an input to production also increases. Graph the original demand and supply curves, and the curves after the substitute good and input prices increase. How will the equilibrium price change after the substitute and input prices increase?
9) Suppose the market for potatoes can be expressed as follows:
If the government sets a maximum price of $10 per unit, what will be the quantity demanded and quantity supplied?
9) Suppose the market for potatoes can be expressed as follows:
- Supply: QS = -20 + 10p
- Demand: QD = 400 - 20p
If the government sets a maximum price of $10 per unit, what will be the quantity demanded and quantity supplied?
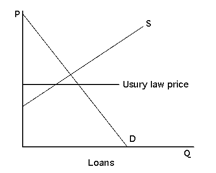 Figure 2.8
10) Usury laws place a ceiling on interest rates that lenders such as banks can charge
borrowers. The interest rate is the price of a loan. Graph a binding usury law on the market for loans, and describe the effects of the law on the quantity of loans supplied and the quantity of loans demanded.
11) Suppose the market for potatoes can be expressed as follows:
Suppose the government restricts the quantity to 100 units. What will be the price of potatoes?
borrowers. The interest rate is the price of a loan. Graph a binding usury law on the market for loans, and describe the effects of the law on the quantity of loans supplied and the quantity of loans demanded.
11) Suppose the market for potatoes can be expressed as follows:
- Supply: QS = -20 + 10p
- Demand: QD = 400 - 20p
Suppose the government restricts the quantity to 100 units. What will be the price of potatoes?
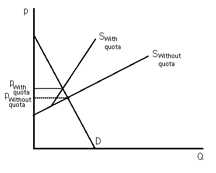 Figure 2.9
12) Use a supply-and-demand graph to predict what happens to sheet steel prices in the United States after quotas on Japanese and European sheet steel expire.
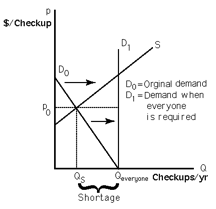 Figure 2.10
13) Assume that the market for annual physical checkups is in equilibrium, and not everyone gets an annual physical checkup. What is the effect on price and quantity if a government regulation fixes price at the current level and requires everyone to get an annual physical checkup?
Answers to Problems From 1 to 13
1: Solve for the individual, regular demand curve, qi = 4 - 2P. Multiply the individual demand curve by 50 to yield QD = 200 - 100P.
Diff: 2
Topic: Demand
2: The slope is -2. The slope tells us how a change in the price of pizzas affects the quantity of pizzas demanded. An increase in the price of pizzas by $1 will result in a decrease of the quantity demanded by 2 pizzas.
Diff: 1
Topic: Demand
3: In all cases, total expenditure equals 100. In general, a nonlinear demand curve of the form Q = A/p means that consumers wish to spend a total of A on this good regardless of its price.
Diff: 2
Topic: Demand
4: First, Q = 100q since all firms are identical. This gives two points: (p = 2,Q = 0) and (p = 10,Q = 1000). From the first point, it is known that p = 2 + bQ. When Q = 1000, 10 = 2 + b(1000). Solving for b yields b = .008. Rearranging to solve for Q yields: Q = -250 + 125p.
Diff: 2
Topic: Supply
5: Equate the RHS of the supply equation to the RHS of the demand equation: -20 +10p = 400 - 20p.
Rearrange: 30p = 420 or p =14. Plug this into either S or D to get Q:
Q = 400 - 20(14) = 120.
Diff: 1
Topic: Market Equilibrium
6: See Figure 2.5. At the suburban shopping mall, the only cars typically on the lot belong to shoppers and employees. Mall lots are usually built to be large enough to handle peak crowds. For the relevant quantities, the supply curve is horizontal at a price of zero. As a result, the quantity demanded never exceeds the amount that is provided freely. Downtown, shoppers compete with a larger quantity and greater variety of drivers for parking spaces. The quantity that is available freely is not enough to accommodate all of those who wish to park downtown.
Diff: 2
Topic: Market Equilibrium
7: See Figure 2.6. The leftward shift in the supply of tea causes tea prices to increase. Since coffee and tea are substitutes, the demand for coffee increases, resulting in higher coffee prices.
Diff: 1
Topic: Shocking the Equilibrium
8: See Figure 2.7. The new demand curve will be to the right of the original demand curve and the new supply curve will be to the left of the original supply curve. The equilibrium price will increase.
Diff: 1
Topic: Shocking the Equilibrium
9: With a maximum price of $10, suppliers will sell only 80 units.
(Q=-20+10(10)=80). But at a price of $10, buyers wish to purchase 200 units: Q=400-20(10)=200. Thus, there will be excess demand of 120 units.
Diff: 1
Topic: Effects of Government Intervention
10: See Figure 2.8. The usury law will result in more loans being demanded and fewer loans being supplied.
Diff:1
Topic: Effects of Government Intervention
11: 1) Find the inverse supply curve: p = 2+.1Q If quantity were restricted to 100 units, sellers would require only $12 per unit.
2) Find the inverse demand curve: p= 20-.05Q. Buyers would be willing to pay $15 per unit and would bid the price up to that amount.
Diff: 2
Topic: Effects of Government Intervention
12: See Figure 2.9. The quota-restricted supply results in a higher price than the market equilibrium. When the quotas expire, the Japanese and European steel firms export into the United States based upon their own supply curves. The new equilibrium will be at a lower price.
Diff: 2
Topic: Effects of Government Intervention
13: See Figure 2.10. Requiring everyone to get a physical would shift the demand curve rightward. With price remaining fixed, a shortage will result.
Diff: 2
Topic: Effects of Government Intervention
Diff: 2
Topic: Demand
2: The slope is -2. The slope tells us how a change in the price of pizzas affects the quantity of pizzas demanded. An increase in the price of pizzas by $1 will result in a decrease of the quantity demanded by 2 pizzas.
Diff: 1
Topic: Demand
3: In all cases, total expenditure equals 100. In general, a nonlinear demand curve of the form Q = A/p means that consumers wish to spend a total of A on this good regardless of its price.
Diff: 2
Topic: Demand
4: First, Q = 100q since all firms are identical. This gives two points: (p = 2,Q = 0) and (p = 10,Q = 1000). From the first point, it is known that p = 2 + bQ. When Q = 1000, 10 = 2 + b(1000). Solving for b yields b = .008. Rearranging to solve for Q yields: Q = -250 + 125p.
Diff: 2
Topic: Supply
5: Equate the RHS of the supply equation to the RHS of the demand equation: -20 +10p = 400 - 20p.
Rearrange: 30p = 420 or p =14. Plug this into either S or D to get Q:
Q = 400 - 20(14) = 120.
Diff: 1
Topic: Market Equilibrium
6: See Figure 2.5. At the suburban shopping mall, the only cars typically on the lot belong to shoppers and employees. Mall lots are usually built to be large enough to handle peak crowds. For the relevant quantities, the supply curve is horizontal at a price of zero. As a result, the quantity demanded never exceeds the amount that is provided freely. Downtown, shoppers compete with a larger quantity and greater variety of drivers for parking spaces. The quantity that is available freely is not enough to accommodate all of those who wish to park downtown.
Diff: 2
Topic: Market Equilibrium
7: See Figure 2.6. The leftward shift in the supply of tea causes tea prices to increase. Since coffee and tea are substitutes, the demand for coffee increases, resulting in higher coffee prices.
Diff: 1
Topic: Shocking the Equilibrium
8: See Figure 2.7. The new demand curve will be to the right of the original demand curve and the new supply curve will be to the left of the original supply curve. The equilibrium price will increase.
Diff: 1
Topic: Shocking the Equilibrium
9: With a maximum price of $10, suppliers will sell only 80 units.
(Q=-20+10(10)=80). But at a price of $10, buyers wish to purchase 200 units: Q=400-20(10)=200. Thus, there will be excess demand of 120 units.
Diff: 1
Topic: Effects of Government Intervention
10: See Figure 2.8. The usury law will result in more loans being demanded and fewer loans being supplied.
Diff:1
Topic: Effects of Government Intervention
11: 1) Find the inverse supply curve: p = 2+.1Q If quantity were restricted to 100 units, sellers would require only $12 per unit.
2) Find the inverse demand curve: p= 20-.05Q. Buyers would be willing to pay $15 per unit and would bid the price up to that amount.
Diff: 2
Topic: Effects of Government Intervention
12: See Figure 2.9. The quota-restricted supply results in a higher price than the market equilibrium. When the quotas expire, the Japanese and European steel firms export into the United States based upon their own supply curves. The new equilibrium will be at a lower price.
Diff: 2
Topic: Effects of Government Intervention
13: See Figure 2.10. Requiring everyone to get a physical would shift the demand curve rightward. With price remaining fixed, a shortage will result.
Diff: 2
Topic: Effects of Government Intervention